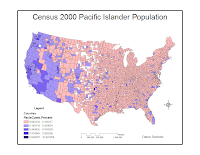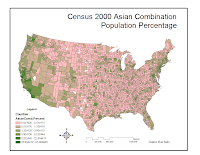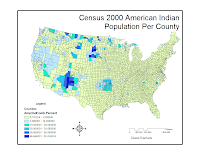


These maps show the distribution of Pacific Islander (Including Hawaiian) people alone and in combination with one or more races, people of Asian descent alone or in combination with one or more races, and populations of American Indian people alone or in combination with one or more races. These maps show populations greater than zero, ranked by percent of the specific population to the whole population of the county. It is interesting to note that there is a representative of all three nationalities in almost all counties in the United States. There appears to be at least one person of American Indian descent in every county in the continental United States. There are only a score or so counties that have no people of Asian descent. There are about 100 or so counties, mostly in the middle states, above, to the west of, and including Texas, that have no persons of Pacific Islander descent at all. On the West Coast, one large county in Washington seems to stand out as an anomaly of no Pacific Islander decendants at all among the generally higher percentage of these immigrants to the West Coast.
The trends for Pacific Islander and Asian immigrants seem to be to settle in the West Coast states generally, with many satellite groups within all states of the contiguous 48. There are some larger populations of Asian peoples in the business areas of the north east U.S. As a counter point, even though there seems to be a person with some type of American Indian descent in all 50 states, and all counties, the populations are really centralized to what would seem to be reservations or areas of specific population groups. It seems that there is not as much intermingling of American Indian people into the general population as there is for the other nationalities.
No comments:
Post a Comment